Covid-19 INSPIRE hackathon 2020 has 13 challenges, one of them is Earth observation for monitoring of regional food supplies deviations.
Covid-19 pandemic and mainly subsequent restrictions was and still is a test for the food supply chain in order to provide enough food to the market to the end customers. Especially in crises a good decision can be made only with enough information. During the previous INSPIRE hackathons the yield potential maps were derived. These potential yields are highly prone to the seasonal effects such as drought, floods, optimal amount of rainfall, duration of insolation, temperature and others which can make the predictions highly different from the reality.
The challenge is to make the yield predictions more realistic by combining the predictions with the actual seasonal conditions. The more realistic the prediction is the better decision can policymakers make to prevent the danger of lack of food. Comparing yield prediction with more realistic predictions will help insurance companies to quantify the effect of the specific damage issue.
The goal of challenges is to design methods of monitoring yield and climatic conditions during the season, which can influence negatively or positively yield in the season. As the reference layer will be used the yield production zones with the trends during the season. Temporal trends or events will be analysed on the base of three types of information
- yield trends with RS indices https://custom-scripts.sentinel-hub.com/custom-scripts/sentinel-2/indexdb/
- Sentinel 1 based information about soil moisture
- COPERNICUS climate services


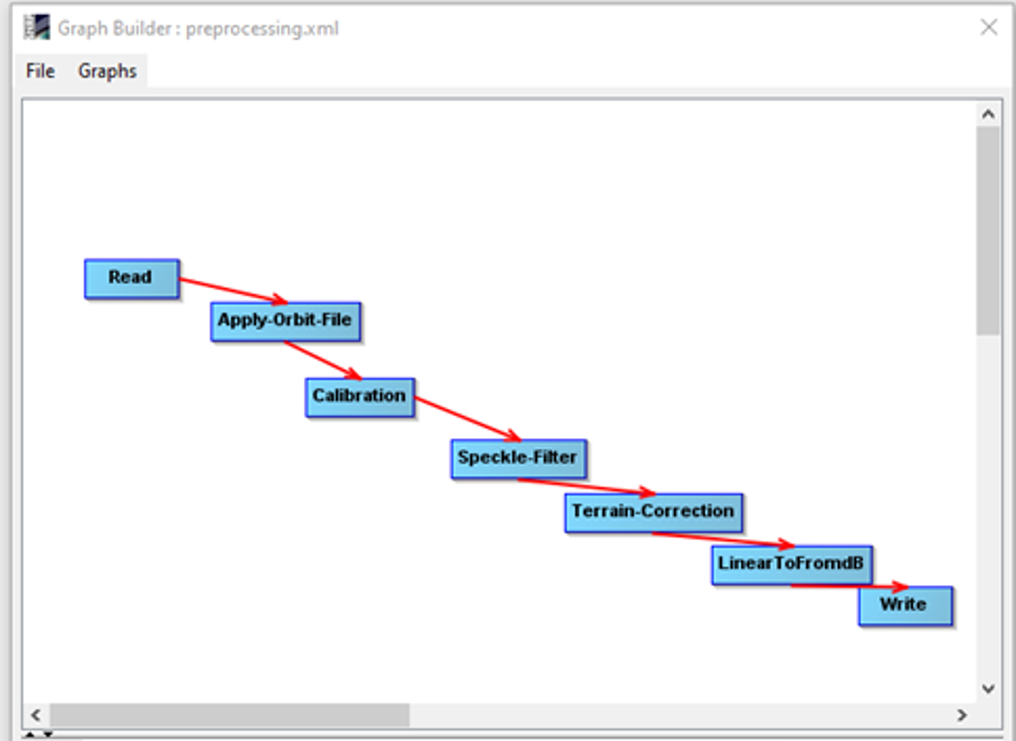
Figure 1: Deriving soil moisture from Sentinel-1 – workflow in SNAP
For the hackathon we plan to use and test results on more farms using historical satellite and climatic data from the last three years and if available we will compare these results with data from yield monitors. This data will be used for calibration. For analysis we will use statistical and visual methods already available on Lesprojekt cloud and additionally we will also use AI algorithms. The AI frameworks are available on Lesprojekt cloud too. The main goal is to be able to predict during season problems with production and give in advance warning.
Yield production zones are areas with the same yield level within the fields. Yield is the integrator of landscape and climatic variability and provides useful information for identifying management zones [1]. This presents a basic delineation of management zones for site specific crop management, which is usually based on yield maps over the past few years. Similar to the evaluation of yield variation from multiple yield data described by Blackmore et al. [2], the aim is to identify high yielding (above the mean) and low yielding areas related as the percentage to the mean value of the field. Also, yield data’s inter-year spatial variance is important for agronomists to distinguish between areas with stable or unstable yields. The presence of complete series of yield maps for all fields is rare, thus remote sensed data are analysed to determine in field variability of crops thru vegetation indices.

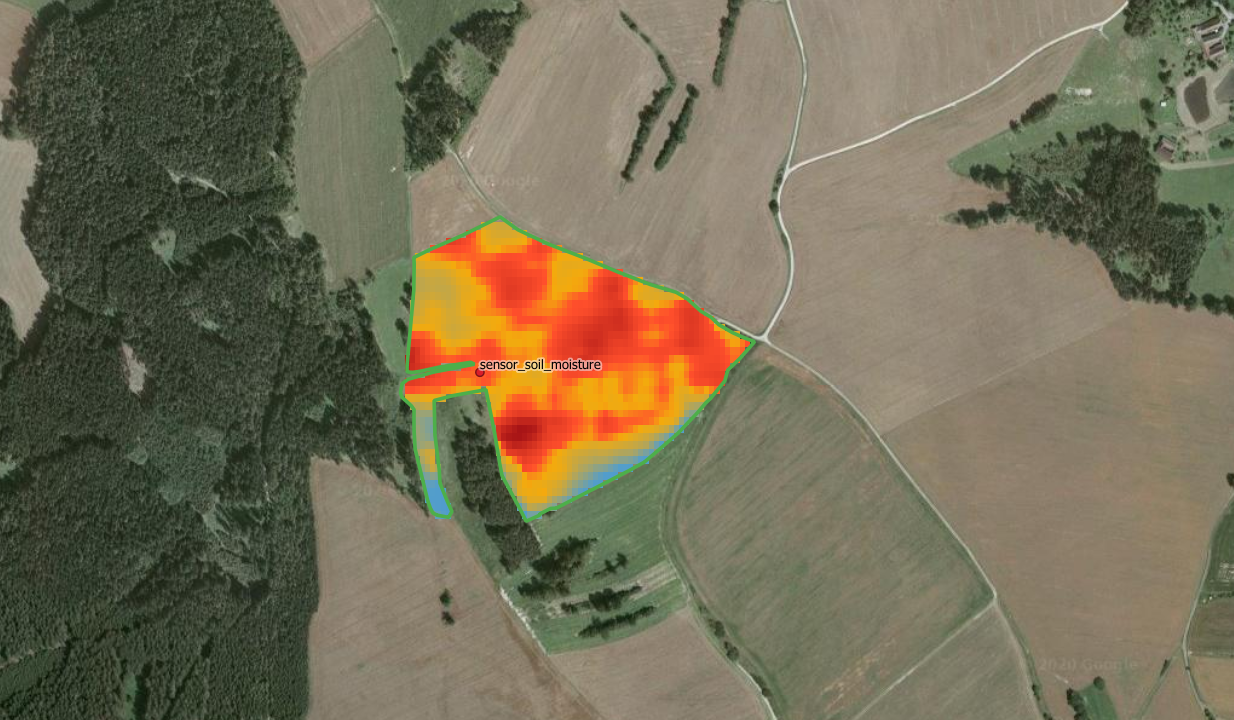
Figure 2: Map of yield potential delineated from multi-temporal Landsat imagery
[1] K. Charvát, T. Řezník, V. Lukas, K. Charvát, Š. Horáková, M. Kepka, M. Šplíchal QUO VADIS PRECISION FARMING, 13th International Conference on Precision Agriculture, July 31 – August 4, 2016, St. Louis, Missouri, USA
[2] Blackmore, B. & Godwin, Richard & Fountas, Spyros. (2003). The Analysis of Spatial and Temporal Trends in Yield Map Data over Six Years. Biosystems Engineering. 84. 455-466. 10.1016/S1537-5110(03)00038-2.
